Exam 16: Supplement Operational Decision-Making Tools: Transportation and Transshipment Models
Exam 1: Introduction to Operations and Supply Chain Management79 Questions
Exam 2: Supplement Operational Decision-Making Tools: Decision Analysis43 Questions
Exam 3: Quality Management91 Questions
Exam 4: Statistical Process Control103 Questions
Exam 5: Supplement Operational Decision-Making Tools: Acceptance Sampling28 Questions
Exam 6: Product Design86 Questions
Exam 7: Service Design77 Questions
Exam 8: Processes and Technology47 Questions
Exam 9: Capacity and Facilities90 Questions
Exam 10: Supplement Operational Decision-Making Tools: Facility Location Models22 Questions
Exam 11: Human Resources90 Questions
Exam 12: Supplement Operational Decision-Making Tools: Work Measurement26 Questions
Exam 13: Project Management98 Questions
Exam 14: Supply Chain Management Strategy and Design73 Questions
Exam 15: Global Supply Chain Procurement and Distribution86 Questions
Exam 16: Supplement Operational Decision-Making Tools: Transportation and Transshipment Models28 Questions
Exam 17: Forecasting94 Questions
Exam 18: Inventory Management93 Questions
Exam 19: Supplement Operational Decision-Making Tools: Simulation25 Questions
Exam 20: Sales and Operations Planning85 Questions
Exam 21: Supplement Operational Decision-Making Tools: Linear Programming38 Questions
Exam 22: Enterprise Resource Planning92 Questions
Exam 23: Lean Systems86 Questions
Exam 24: Scheduling99 Questions
Select questions type
The following transportation table shows the cost of shipping one unit from each source to each destination in the upper right hand corner of each cell,as well as the supply capacities and demand requirements:  The optimal solution is:
 The total cost of the shipping plan is:
Free
(Multiple Choice)
4.9/5  (42)
(42)
Correct Answer: Verified
D
The following transportation table shows the cost of shipping one unit from each source to each destination in the upper right hand corner of each cell,as well as the supply capacities and demand requirements: 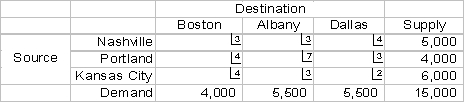 The optimal solution is:
 The total amount shipped from Portland to Dallas is:
Free
(Multiple Choice)
4.9/5 (36)
Correct Answer:Verified
C
The following transportation table shows the cost of shipping one unit from each source to each destination in the upper right hand corner of each cell,as well as the supply capacities and demand requirements: 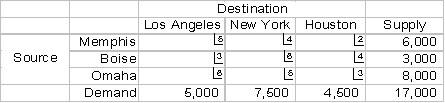 The optimal solution is:
 The total amount shipped from Boise to Los Angeles is:
Free
(Multiple Choice)
4.8/5 (37)
Correct Answer:Verified
C
The stepping-stone method is a quantitative technique that can be used to solve transportation models quantitatively.
(True/False)
4.9/5 (36)
In an unbalanced transportation problem supply and demand are not equal.
(True/False)
4.9/5 (39)
Use this problem for the next four (4)questions.
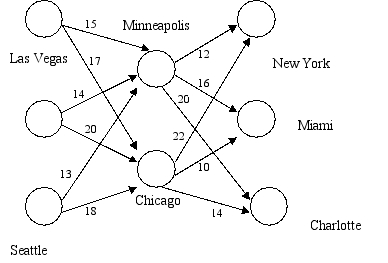
A company has manufacturing plants in Las Vegas,Portland,and Seattle.Items produced from these plants are boxed and shipped to warehouses in Minneapolis and Chicago where they are tested and repackaged for distribution to final customers in New York,Miami,and Charlotte.The network of transshipment routes shown below indicates the cost associated with shipping a box from the plants to the warehouses and then the cost of shipping the repackaged unit from the warehouses to the final customers.
 Assume that the supply and demand requirements are as shown in the table below.
 The company would like to determine the lowest cost shipping and distribution plan.
The following solution was produced using Microsoft Excel.
The company would like to determine the lowest cost shipping and distribution plan.
The following solution was produced using Microsoft Excel.
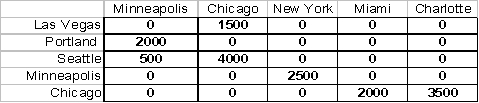 -How many boxes are sent from Seattle to the Chicago transshipment point?
(Multiple Choice)
4.9/5 (35)
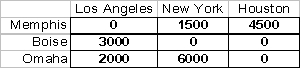
The following transportation table shows the cost of shipping one unit from each source to each destination in the upper right hand corner of each cell,as well as the supply capacities and demand requirements:  The optimal solution is:
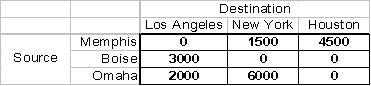 How many units of New York demand are supplied from Omaha?
(Multiple Choice)
4.8/5 (24)
In a transportation model each source is able to supply a fixed number of units of the product and each destination has a fixed demand for the product.
(True/False)
4.9/5 (42)
Each cell in a transportation table represents the amount transported from one source to all destinations.
(True/False)
4.8/5 (40)
It is not possible to solve transportation models using spreadsheets like Microsoft Excel.
(True/False)
4.8/5 (44)
Use this problem for the next four (4)questions.
Anderson Corporation manufactures a product at three different facilities located at Boston,Philadelphia and Atlanta and ships them to warehouses at Chicago,New York,and Dallas.The Boston and Atlanta plants can also ship these products to Philadelphia.The cost to ship one product between facilities,along with the monthly capacities and requirements are shown in the table below.The company would like a plan to minimize total transportation costs.
 Excel provides the following optimal solution:
 -Which facility is not producing at capacity?
(Multiple Choice)
4.8/5 (33)
Transportation models can be solved within the context of a transportation table.
(True/False)
4.9/5 (38)
Having more than one shipping distribution but with the same total cost is known as:
(Multiple Choice)
4.8/5 (29)
The following transportation table shows the cost of shipping one unit from each source to each destination in the upper right hand corner of each cell,as well as the supply capacities and demand requirements:  The optimal solution is:
 The total cost of the shipping plan is:
(Multiple Choice)
5.0/5 (40)
Use this problem for the next four (4)questions.
A company has manufacturing plants in Las Vegas,Portland,and Seattle.Items produced from these plants are boxed and shipped to warehouses in Minneapolis and Chicago where they are tested and repackaged for distribution to final customers in New York,Miami,and Charlotte.The network of transshipment routes shown below indicates the cost associated with shipping a box from the plants to the warehouses and then the cost of shipping the repackaged unit from the warehouses to the final customers.
Assume that the supply and demand requirements are as shown in the table below.
The company would like to determine the lowest cost shipping and distribution plan.
The following solution was produced using Microsoft Excel.
-How many units are shipped through the Minneapolis transshipment point?
(Multiple Choice)
4.8/5 (37)
The following transportation table shows the cost of shipping one unit from each source to each destination in the upper right hand corner of each cell,as well as the supply capacities and demand requirements:  The optimal solution is:
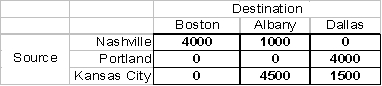 How many units of Albany demand are supplied from Nashville?
(Multiple Choice)
4.8/5 (34)
One way to incorporate a prohibited route in a transportation problem is to
(Multiple Choice)
4.8/5 (37)
The transshipment model is an extension of the transportation model in which intermediate transshipment points are added between the sources and destinations.
(True/False)
4.8/5 (34)
What is the overall cost of the transshipment plan shown above?
(Multiple Choice)
4.7/5 (50)
Filters
- Essay(0)
- Multiple Choice(0)
- Short Answer(0)
- True False(0)
- Matching(0)