Short Answer
TABLE 2-9
The frequency distribution below represents the rents of 250 randomly selected federally subsidized apartments in a small town.
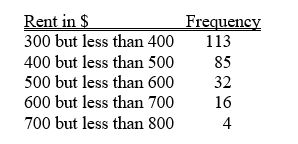
-Referring to Table 2-9, ________ apartments rented for at least $400 but less than $600.
Correct Answer:

Verified
Correct Answer:
Verified
Q38: TABLE 2-7<br>The Stem-and-Leaf display below contains data
Q39: TABLE 2-6<br>A sample of 200 students at
Q40: TABLE 2-11<br>The ordered array below resulted from
Q41: TABLE 2-9<br>The frequency distribution below represents the
Q44: TABLE 2-8<br>The Stem-and-Leaf display represents the number
Q45: TABLE 2-17<br>The following table presents total retail
Q47: TABLE 2-15<br>The figure below is the ogive
Q48: Given below is the scatter plot of
Q104: When constructing charts,the following is plotted at
Q161: In order to compare one large set