Multiple Choice
Use the figure to answer the question.
-The sales figures for the Big "D" Company are shown below in a line graph. 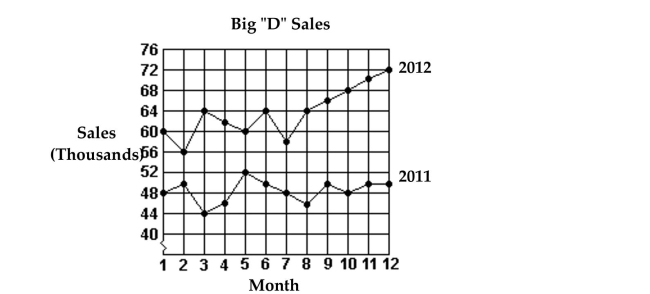 What were the total sales for the first 6 months of 2011?
A) $366,000
B) $240,000
C) $46,000
D) $290,000
Correct Answer:

Verified
Correct Answer:
Verified
Related Questions
Q35: Use the figure to answer the question.<br>-The
Q36: Use the statistical display to answer
Q37: Use the figure to answer the question.<br>-The
Q38: Identify whether the given scatterplot shows a
Q39: Use the figure to answer the
Q41: Construct the requested statistical display.<br>-The attendance
Q42: Use the figure to answer the question.<br>-The
Q43: Construct the requested statistical display.<br>-Kevin asked
Q44: Use the circle graph to solve the
Q45: Use the statistical display to answer the