Multiple Choice
Use the statistical display to answer the question.
-The midterm test scores for the seventh-period typing class are shown below on a dot plot. 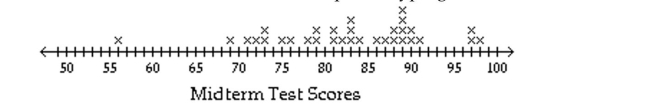 What are the outliers?
A) 86, 87, 88, 89, 90, 91
B) 56
C) 69
D) 97, 98
Correct Answer:

Verified
Correct Answer:
Verified
Related Questions
Q18: Use the figure to answer the
Q19: Use the figure to answer the
Q20: Use the figure to answer the question.<br>-The
Q21: Use the figure to answer the question.<br>-The
Q22: Use the figure to answer the question.<br>-Students
Q24: Use the figure to answer the question.<br>-The
Q25: Use the circle graph to solve the
Q26: Use the figure to answer the question.<br>-The
Q27: Use the statistical display to answer the
Q28: Use the circle graph to solve the