Essay
Use the figure to answer the question.
-Students in Mr. Mason's classes collected items from different countries. The data show how
many of each item one class collected. Construct a bar graph for the frequency data.
Stamps, 9
Postcards, 11
Coins, 7
Books, 13 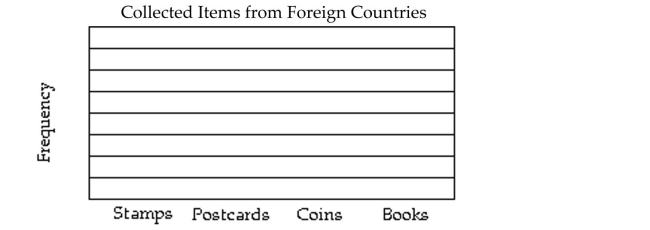
Correct Answer:

Verified
Correct Answer:
Verified
Related Questions
Q17: Use the figure to answer the question.<br>-The
Q18: Use the figure to answer the
Q19: Use the figure to answer the
Q20: Use the figure to answer the question.<br>-The
Q21: Use the figure to answer the question.<br>-The
Q23: Use the statistical display to answer the
Q24: Use the figure to answer the question.<br>-The
Q25: Use the circle graph to solve the
Q26: Use the figure to answer the question.<br>-The
Q27: Use the statistical display to answer the