Essay
Use the figure to answer the question.
-The data below give the figures for the United States production of canned fruit from 2002 to
2009. Make a line graph for the data. 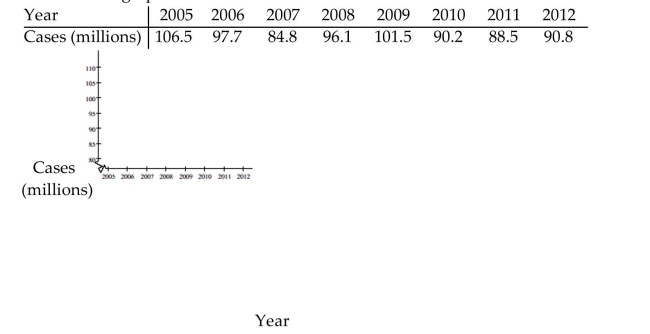
Correct Answer:

Verified
Correct Answer:
Verified
Related Questions
Q21: Use the figure to answer the question.<br>-The
Q22: Use the figure to answer the question.<br>-Students
Q23: Use the statistical display to answer the
Q24: Use the figure to answer the question.<br>-The
Q25: Use the circle graph to solve the
Q27: Use the statistical display to answer the
Q28: Use the circle graph to solve the
Q29: Use the figure to answer the question.<br>-The
Q30: Identify whether the given scatterplot shows a
Q31: Use the figure to answer the question.<br>-This