Multiple Choice
Use the figure to answer the question.
-The sales figures for the Big "D" Company are shown below in a line graph. 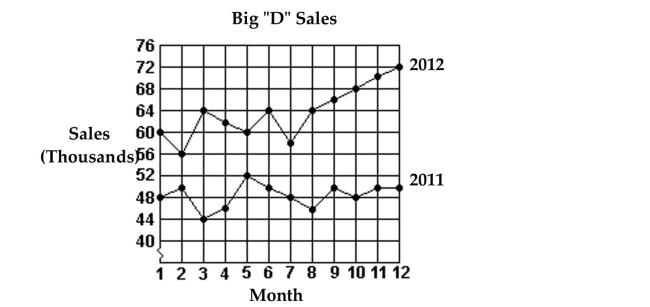 Which month in 2012 had the highest sales?
A) Month 3
B) Month 5
C) Month 6
D) Month 12
Correct Answer:

Verified
Correct Answer:
Verified
Related Questions
Q16: Use the figure to answer the question.<br>-The
Q17: Use the figure to answer the question.<br>-The
Q18: Use the figure to answer the
Q19: Use the figure to answer the
Q20: Use the figure to answer the question.<br>-The
Q22: Use the figure to answer the question.<br>-Students
Q23: Use the statistical display to answer the
Q24: Use the figure to answer the question.<br>-The
Q25: Use the circle graph to solve the
Q26: Use the figure to answer the question.<br>-The