Multiple Choice
Use the circle graph to solve the problem.
-In a school survey, students showed these preferences for instructional materials. 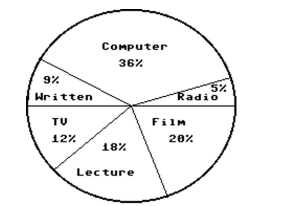 About how many students would you expect to prefer films in a school of 350 students?
A) About 20 students
B) About 63 students
C) About 42 students
D) About 70 students
Correct Answer:

Verified
Correct Answer:
Verified
Q20: Use the figure to answer the question.<br>-The
Q21: Use the figure to answer the question.<br>-The
Q22: Use the figure to answer the question.<br>-Students
Q23: Use the statistical display to answer the
Q24: Use the figure to answer the question.<br>-The
Q26: Use the figure to answer the question.<br>-The
Q27: Use the statistical display to answer the
Q28: Use the circle graph to solve the
Q29: Use the figure to answer the question.<br>-The
Q30: Identify whether the given scatterplot shows a