Multiple Choice
Use the figure to answer the question.
-The weights (in pounds) of a group of high school students are listed below in a stem-and-leaf plot. 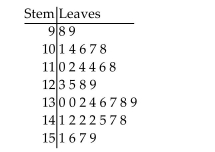 Which interval has the most students in it?
A) 130-139
B) 110-119
C) 140-149
D) 90-99
Correct Answer:

Verified
Correct Answer:
Verified
Related Questions
Q2: Use the figure to answer the question.<br>-The
Q3: Use the figure to answer the question.<br>-The
Q4: Use the figure to answer the
Q5: Use the statistical display to answer the
Q6: Use the statistical display to answer the
Q8: Use the circle graph to solve the
Q9: Identify whether the given scatterplot shows a
Q10: Use the circle graph to solve the
Q11: Use the figure to answer the question.<br>-The
Q12: Use the statistical display to answer the