Multiple Choice
Use the figure to answer the question.
-The following scatterplot shows the heights (in inches) of a group of children and their ages. 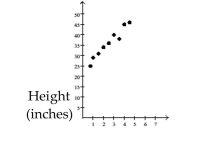 Age (years) From this data, conjecture how old you think a child is who is about 39 inches tall?
A) 1 year
B) 3 months
C) 3 years
D) 7 years
Correct Answer:

Verified
Correct Answer:
Verified
Related Questions
Q1: Use the statistical display to answer the
Q2: Use the figure to answer the question.<br>-The
Q4: Use the figure to answer the
Q5: Use the statistical display to answer the
Q6: Use the statistical display to answer the
Q7: Use the figure to answer the question.<br>-The
Q8: Use the circle graph to solve the
Q9: Identify whether the given scatterplot shows a
Q10: Use the circle graph to solve the
Q11: Use the figure to answer the question.<br>-The