Multiple Choice
Use the figure to answer the question.
-The following scatterplot shows the heights (in inches) of a group of children and their ages. 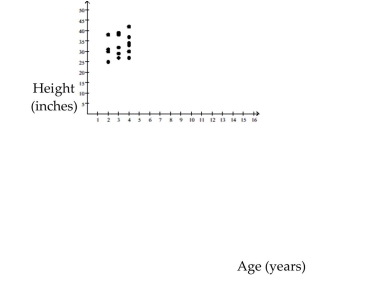 What can be the expected height range for a 2-year-old child?
A) 25-38 inches
B) 35-45 inches
C) 40-50 inches
D) 20-30 inches
Correct Answer:

Verified
Correct Answer:
Verified
Related Questions
Q1: Use the statistical display to answer the
Q3: Use the figure to answer the question.<br>-The
Q4: Use the figure to answer the
Q5: Use the statistical display to answer the
Q6: Use the statistical display to answer the
Q7: Use the figure to answer the question.<br>-The
Q8: Use the circle graph to solve the
Q9: Identify whether the given scatterplot shows a
Q10: Use the circle graph to solve the
Q11: Use the figure to answer the question.<br>-The