Short Answer
The following multiple line graph shows the numbers of death due to cancer in four geographic regions of the U.S. that occurred in three ethnic groups in 2003. 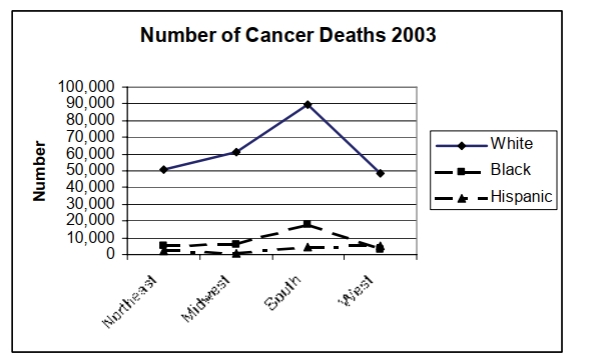
In which geographic area was the number of cancer deaths among whites the highest in 2003?
Correct Answer:

Verified
Correct Answer:
Verified
Related Questions
Q25: The data below represent the results
Q26: The table shows the end-of-the-month checking
Q27: Find the original data from the
Q28: Using the graphical display below.<br> <img src="https://d2lvgg3v3hfg70.cloudfront.net/TB2967/.jpg"
Q29: The table shows the price of
Q31: The histogram below shows the ages of
Q32: After reviewing a movie, 400 people
Q33: The table lists the winners of
Q34: Which line chart below represents the
Q35: Which line chart below represents the