Multiple Choice
The table shows the price of a volatile stock from the months January 1999 through December 1999 as determined by the closing price on the last trading day of the month. The price is rounded to the nearest dollar.
Which time series line chart represents the data?
A) 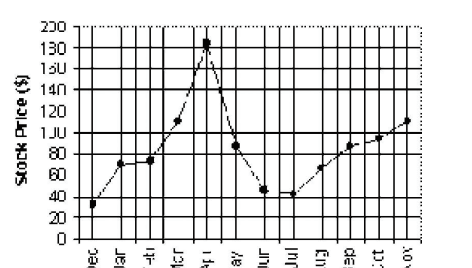
B) 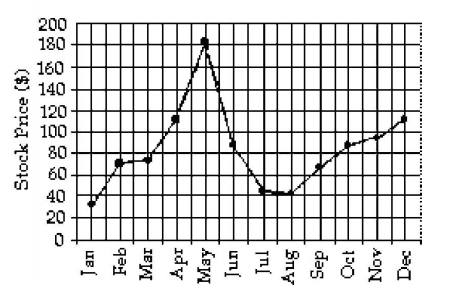
C) 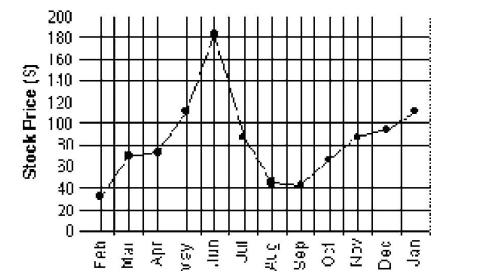
D) None of the above
Correct Answer:

Verified
Correct Answer:
Verified
Q24: The stacked bar chart below shows the
Q25: The data below represent the results
Q26: The table shows the end-of-the-month checking
Q27: Find the original data from the
Q28: Using the graphical display below.<br> <img src="https://d2lvgg3v3hfg70.cloudfront.net/TB2967/.jpg"
Q30: The following multiple line graph shows the
Q31: The histogram below shows the ages of
Q32: After reviewing a movie, 400 people
Q33: The table lists the winners of
Q34: Which line chart below represents the