Short Answer
The data below represent the results of a poll in which the following question was asked:, "To what degree are you satisfied with the outcome of the 2012 gubernatorial election?" Which pie chart below represents the given data set?
A)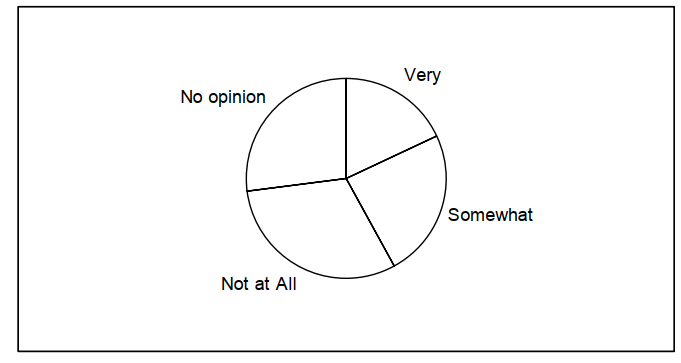
B)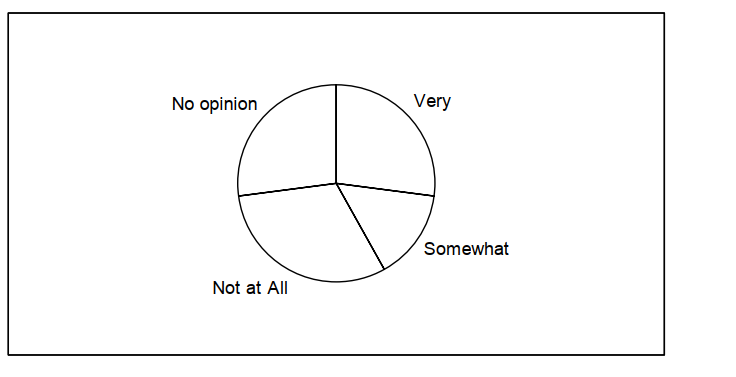
Correct Answer:

Verified
Correct Answer:
Verified
Q20: On Monday mornings, a bookie tabulates the
Q21: A nurse measured the blood pressure of
Q22: The frequency table shows the lengths
Q23: The time series line chart below shows
Q24: The stacked bar chart below shows the
Q26: The table shows the end-of-the-month checking
Q27: Find the original data from the
Q28: Using the graphical display below.<br> <img src="https://d2lvgg3v3hfg70.cloudfront.net/TB2967/.jpg"
Q29: The table shows the price of
Q30: The following multiple line graph shows the