Multiple Choice
The table shows the end-of-the-month checking account balance of a statistics teacher for the months January 1999 through December 1999 as determined by the closing balance on the last banking day of the month. The balance is rounded to the nearest dollar.
Which time series line chart represents the data?
A) 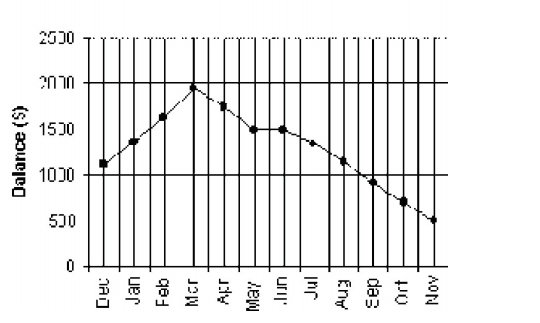
B) 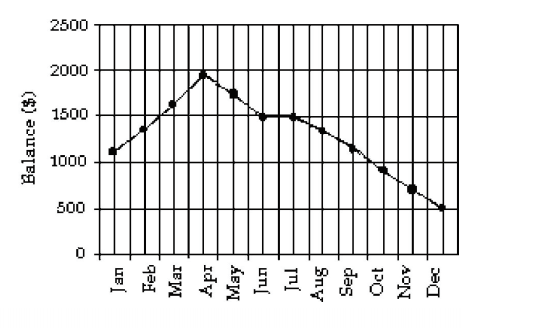
C) 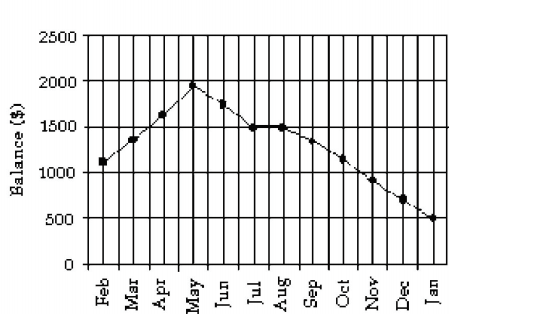
D) None of the above
Correct Answer:

Verified
Correct Answer:
Verified
Q21: A nurse measured the blood pressure of
Q22: The frequency table shows the lengths
Q23: The time series line chart below shows
Q24: The stacked bar chart below shows the
Q25: The data below represent the results
Q27: Find the original data from the
Q28: Using the graphical display below.<br> <img src="https://d2lvgg3v3hfg70.cloudfront.net/TB2967/.jpg"
Q29: The table shows the price of
Q30: The following multiple line graph shows the
Q31: The histogram below shows the ages of