Multiple Choice
Which of the following statements best describes the distribution and variability of the histogram below? The data in the histogram summarizes length of time on hold for a collection of customers calling a repair call center. 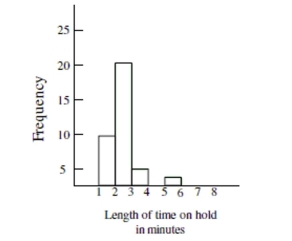
A) The distribution shows that the data was highly variable with some callers waiting on hold as many as 20 minutes.
B) The distribution is left-skewed and most callers waited on hold at least three minutes.
C) The distribution is symmetrical. The number of callers who waited on hold for less than three minutes was the same as the number of callers who waited on hold for more than three minutes.
D) The distribution is right-skewed and most callers waited on hold less than three minutes.
Correct Answer:

Verified
Correct Answer:
Verified
Q1: Data was collected on hand grip strength
Q2: The graph below displays the number of
Q5: The graph below displays the number of
Q6: Describe the shape of the distribution in
Q7: Choose the histogram that matches the description.<br>-The
Q8: Based on the histogram below, would it
Q10: The histogram below displays the distribution of
Q44: Which type of take- out food is
Q47: Write a sentence to compare color preferences
Q50: What was the most common response for