Multiple Choice
The graph below displays the number of homicides in the city of Flint, Michigan for each of the last three years. A reported interprets this graph to mean that the number of murders in 2010 was more Than twice the number of murders in 2008. Is the reporter making a correct interpretation? 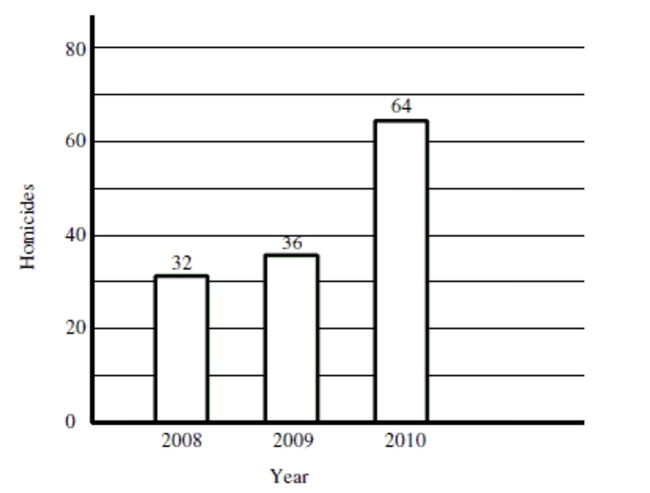
A) No. The width of the bars is identical, indicating that the number of murders in 2010 is no different from 2008.
B) There is not enough information given in the graph to determine whether the reporter's interpretation is correct or not.
C) Yes. The bar for 2010 is twice the height of the bar for 2008 and the number of murders indicated above the bars confirms that murders in 2010 were more than twice the level in 2008.
Correct Answer:

Verified
Correct Answer:
Verified
Q1: Data was collected on hand grip strength
Q3: Which of the following statements best describes
Q5: The graph below displays the number of
Q6: Describe the shape of the distribution in
Q7: Choose the histogram that matches the description.<br>-The
Q8: Based on the histogram below, would it
Q10: The histogram below displays the distribution of
Q44: Which type of take- out food is
Q47: Write a sentence to compare color preferences
Q50: What was the most common response for