Multiple Choice
The following frequency distribution presents the frequency of passenger vehicles that pass through a certain intersection from 8:00 AM to 9:00 AM on a particular day. Construct a pie chart for the data.
A) 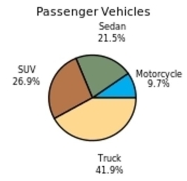
B) 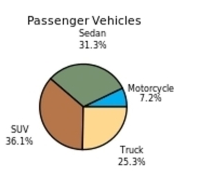
C) 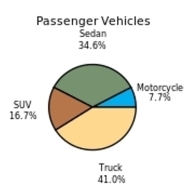
D) 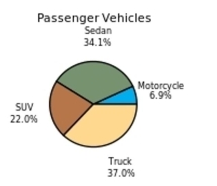
Correct Answer:

Verified
Correct Answer:
Verified
Related Questions
Q16: Construct a stem-and-leaf plot for the
Q17: Toy sales: The following graph presents the
Q18: A sample of 200 high school
Q19: The following frequency distribution presents the
Q20: The following pie chart presents the percentages
Q22: The following table presents the purchase
Q23: Helium prices: The cost of grade A
Q24: Classify the histogram as unimodal or bimodal.
Q25: Thirty households were surveyed for the
Q26: Construct a stem-and-leaf plot for the