Multiple Choice
Thirty households were surveyed for the number of televisions in each home. Following are the results.
Construct a frequency histogram.
A) 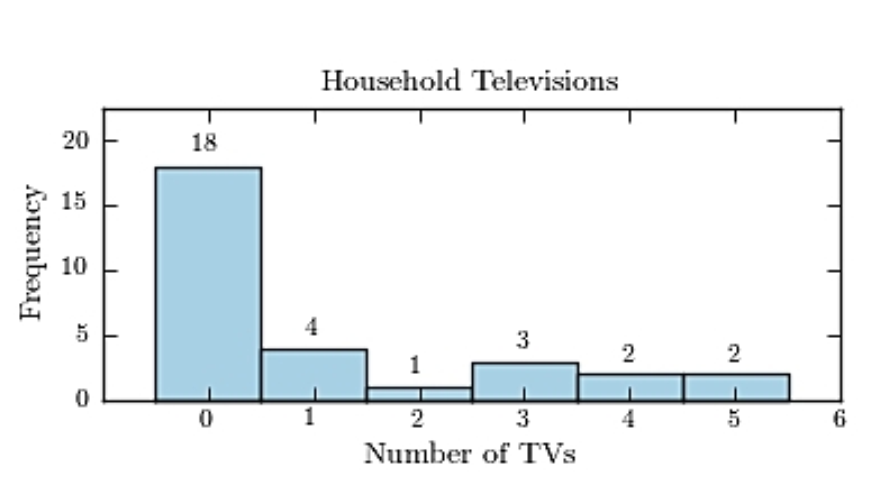
B) 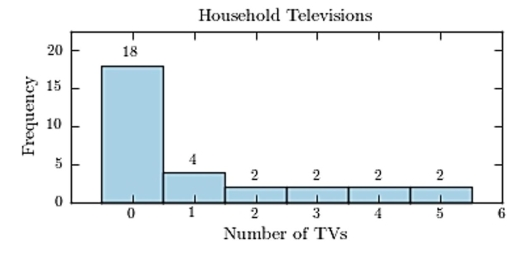
C) 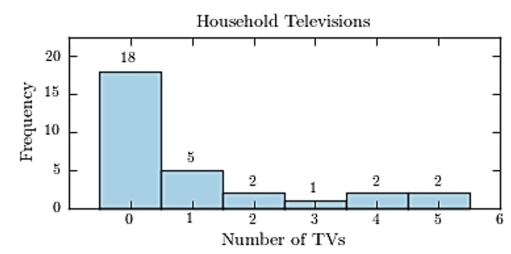
D) 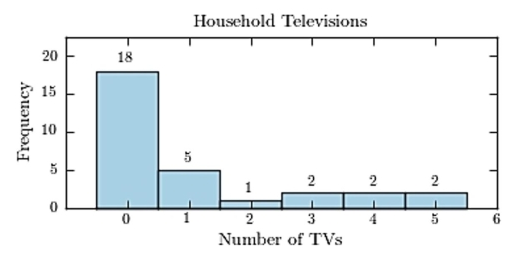
Correct Answer:

Verified
Correct Answer:
Verified
Related Questions
Q20: The following pie chart presents the percentages
Q21: The following frequency distribution presents the
Q22: The following table presents the purchase
Q23: Helium prices: The cost of grade A
Q24: Classify the histogram as unimodal or bimodal.
Q26: Construct a stem-and-leaf plot for the
Q27: The following frequency distribution presents the
Q28: The amounts 3 and 4 are compared.
Q29: The following pie chart presents the percentages
Q30: The following time-series plot presents the population