Multiple Choice
Helium prices: The cost of grade A Helium gas in 2003 was around $60/Mcf. Five years later it reached around $115/Mcf. Which of the following graphs accurately represents the magnitude of the Increase? Which one exaggerates it?
A) 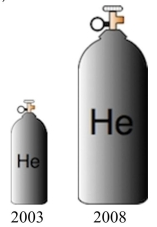
B) 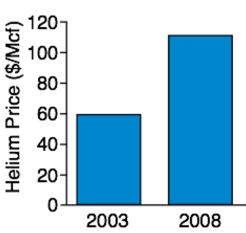
Correct Answer:

Verified
Correct Answer:
Verified
Related Questions
Q18: A sample of 200 high school
Q19: The following frequency distribution presents the
Q20: The following pie chart presents the percentages
Q21: The following frequency distribution presents the
Q22: The following table presents the purchase
Q24: Classify the histogram as unimodal or bimodal.
Q25: Thirty households were surveyed for the
Q26: Construct a stem-and-leaf plot for the
Q27: The following frequency distribution presents the
Q28: The amounts 3 and 4 are compared.