Multiple Choice
TABLE 2-15
The figure below is the ogive for the amount of fat (in grams) for a sample of 36 pizza products where the upper boundaries of the intervals are: 5, 10, 15, 20, 25, and 30.
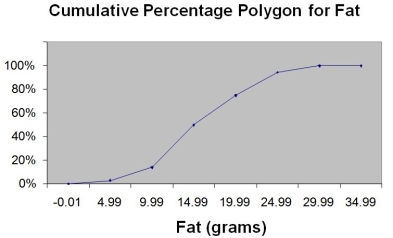
-Referring to Table 2-15, roughly what percentage of pizza products contain less than 10 grams of fat?
A) 3%
B) 14%
C) 50%
D) 75%
Correct Answer:

Verified
Correct Answer:
Verified
Q14: TABLE 2-9<br>The frequency distribution below represents the
Q87: TABLE 2-18<br>The stem-and-leaf display below shows the
Q93: TABLE 2-12<br>The table below contains the opinions
Q97: TABLE 2-13<br>Given below is the stem-and-leaf display
Q110: Given below is the scatter plot of
Q112: TABLE 2-1<br>An insurance company evaluates many numerical
Q160: TABLE 2-6<br>A sample of 200 students at
Q175: TABLE 2-8<br>The Stem-and-Leaf display represents the number
Q181: TABLE 2-5<br>The following are the duration in
Q206: TABLE 2-2<br>At a meeting of information systems