True/False
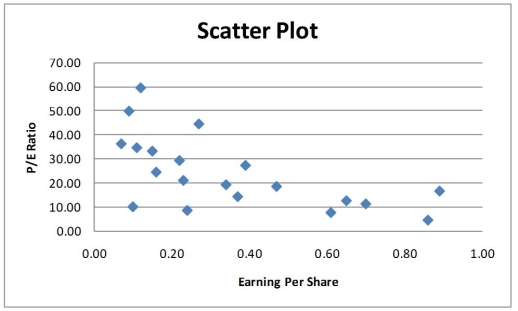
Given below is the scatter plot of the price/earnings ratio versus earnings per share of 20 U.S. companies. There appears to be a negative relationship between price/earnings ratio and earnings per share.
Correct Answer:

Verified
Correct Answer:
Verified
Q14: TABLE 2-9<br>The frequency distribution below represents the
Q81: TABLE 2-12<br>The table below contains the opinions
Q87: TABLE 2-18<br>The stem-and-leaf display below shows the
Q97: TABLE 2-13<br>Given below is the stem-and-leaf display
Q109: TABLE 2-15<br>The figure below is the ogive
Q112: TABLE 2-1<br>An insurance company evaluates many numerical
Q160: TABLE 2-6<br>A sample of 200 students at
Q175: TABLE 2-8<br>The Stem-and-Leaf display represents the number
Q181: TABLE 2-5<br>The following are the duration in
Q206: TABLE 2-2<br>At a meeting of information systems