Multiple Choice
The total cholesterol readings for 40 female patients seen this week at a doctor's office were recorded. Figure is a histogram of these data. Use the following figure.If a patient has a total cholesterol reading higher than 300, a doctor may prescribe a cholesterol-lowering medication as well as a change in diet. What percent of these patients had total cholesterol readings higher than 400? 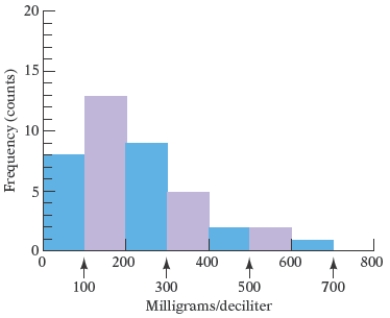
A) 12.5%
B) 14%
C) 14.5%
D) 11%
E) 11.5%
Correct Answer:

Verified
Correct Answer:
Verified
Q48: The heights, in inches, of the
Q49: The circle graph shows the number
Q50: The life expectancies, in years, in
Q51: The pictograph in the following figure gives
Q52: The double-broken-line graph shows the number of
Q54: The circle graph shows the number
Q55: The double-bar graph below shows the fuel
Q56: Most health statistics list normal body temperature
Q57: Each of the letters of the
Q58: The circle graph shows the number