Short Answer
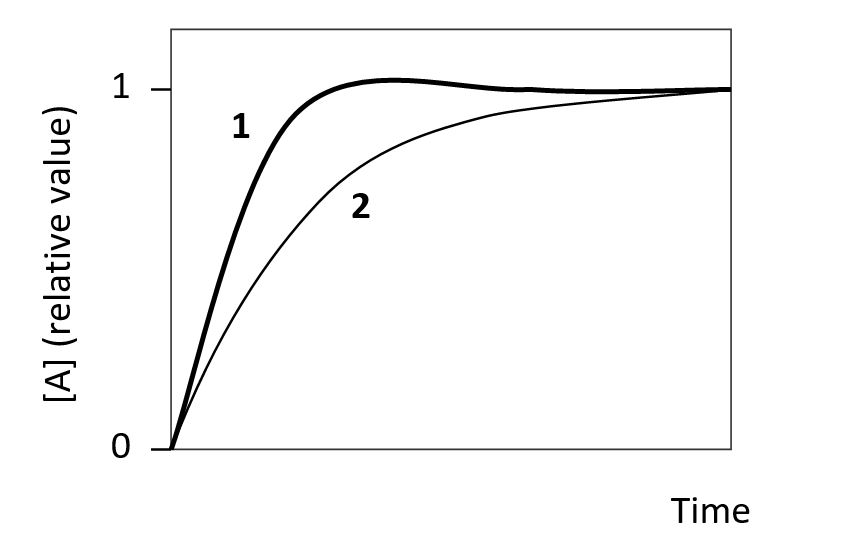
The following graph shows the change in the concentration of a protein (A) over time as a fraction of the final steady-state level. The two curves (1 and 2) in the graph are simulations with similar parameters except that one of them involves a negative feedback loop in which A activates the expression of a repressor protein which in turn represses the expression of A. Which curve (1 or 2) corresponds to the simulation with the negative feedback loop? Write down 1 or 2 as your answer.
Correct Answer:

Verified
Negative feedback can cause o...View Answer
Unlock this answer now
Get Access to more Verified Answers free of charge
Correct Answer:
Verified
View Answer
Unlock this answer now
Get Access to more Verified Answers free of charge
Q85: A piece of DNA has been sequenced
Q86: Sort the following cellular components to reflect
Q87: In purifying proteins by column chromatography, elution
Q88: RNA-seq and ribosome profiling experiments have been
Q89: You have grown cultures of the yeast
Q90: In an unfolded (random coil) protein, amino
Q91: Some feed-forward motifs are capable of generating
Q92: There are six possible reading frames for
Q93: In the following schematic graph, the fraction
Q94: A protein made from an expression vector