Multiple Choice
The bar graph shows the number of tickets sold each week by the garden club for their annual flower show. 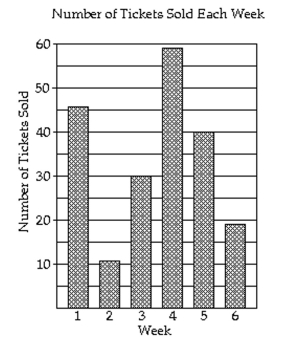
-During which week was the most number of tickets sold?
A) week 5
B) week 2
C) week 1
D) week 4
Correct Answer:

Verified
Correct Answer:
Verified
Related Questions
Q1: The circle graph shows the results of
Q3: Draw a tree diagram to find the
Q4: The line graph shows the recorded hourly
Q5: Find the probability of the event.<br>-Two
Q6: The circle graph shows the results of
Q7: The line graph shows the recorded hourly
Q8: The line graph shows the recorded hourly
Q9: The circle graph shows the results of
Q10: The circle graph summarizes the results
Q11: Find the probability of the event