Multiple Choice
The line graph shows the recorded hourly temperatures in degrees Fahrenheit at an airport. 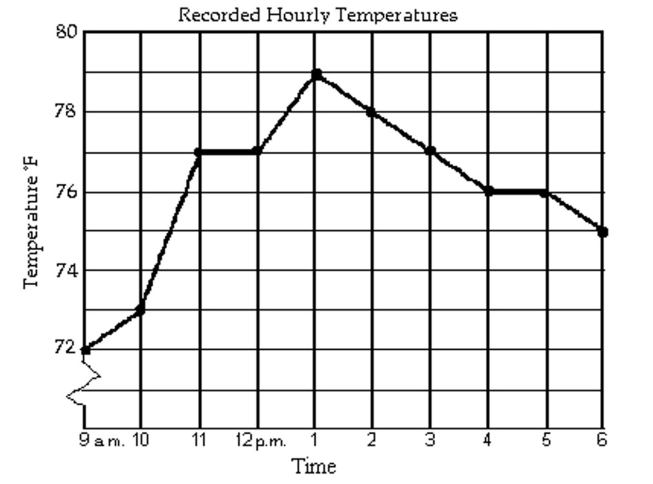
-At what time was the temperature its lowest?
A) 9 a.m.
B) 1 p.m.
C) 6 p.m.
D) 4 p.m.
Correct Answer:

Verified
Correct Answer:
Verified
Related Questions
Q3: Draw a tree diagram to find the
Q4: The line graph shows the recorded hourly
Q5: Find the probability of the event.<br>-Two
Q6: The circle graph shows the results of
Q7: The line graph shows the recorded hourly
Q9: The circle graph shows the results of
Q10: The circle graph summarizes the results
Q11: Find the probability of the event
Q12: The following circle graph displays Chris
Q13: The bar graph shows the number of