Multiple Choice
The circle graph summarizes the results of a survey of the favorite movie category chosen by a group of adults. 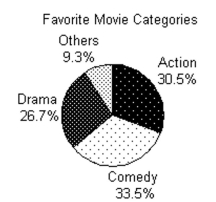
-2400 adults answer the survey. Find the ratio of number of respondents who favor others to those who favor comedies. Write the ratio as a
Fraction with integers in the numerator and denominator.
A)
B)
C)
D)
Correct Answer:

Verified
Correct Answer:
Verified
Q5: Find the probability of the event.<br>-Two
Q6: The circle graph shows the results of
Q7: The line graph shows the recorded hourly
Q8: The line graph shows the recorded hourly
Q9: The circle graph shows the results of
Q11: Find the probability of the event
Q12: The following circle graph displays Chris
Q13: The bar graph shows the number of
Q14: Fill in the blank with one
Q15: The pictograph shows the number of bicycles