Multiple Choice
The circle graph shows the results of the student council presidential election. The complete circular area represents 100%
of the votes.
-Student Council President 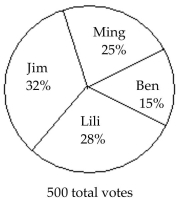 The circle graph shows what percent of the vote each person received. What percent of the votes did Ben NOT get?
A) 85%
B) 15%
C) 72%
D) 68%
Correct Answer:

Verified
Correct Answer:
Verified
Related Questions
Q4: The line graph shows the recorded hourly
Q5: Find the probability of the event.<br>-Two
Q6: The circle graph shows the results of
Q7: The line graph shows the recorded hourly
Q8: The line graph shows the recorded hourly
Q10: The circle graph summarizes the results
Q11: Find the probability of the event
Q12: The following circle graph displays Chris
Q13: The bar graph shows the number of
Q14: Fill in the blank with one