Multiple Choice
The circle graph shows the results of the student council presidential election. The complete circular area represents 100%
of the votes.
-Student Council President 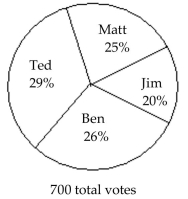 The circle graph shows what percent of the vote each person received. How many people voted for someone other than Ben?
A) 182
B) 518
C) 560
D) 525
Correct Answer:

Verified
Correct Answer:
Verified
Related Questions
Q2: The bar graph shows the number of
Q3: Draw a tree diagram to find the
Q4: The line graph shows the recorded hourly
Q5: Find the probability of the event.<br>-Two
Q6: The circle graph shows the results of
Q7: The line graph shows the recorded hourly
Q8: The line graph shows the recorded hourly
Q9: The circle graph shows the results of
Q10: The circle graph summarizes the results
Q11: Find the probability of the event