Multiple Choice
The following time plot gives the number of deaths from opioid pain relievers in the years 2001 to 2014.
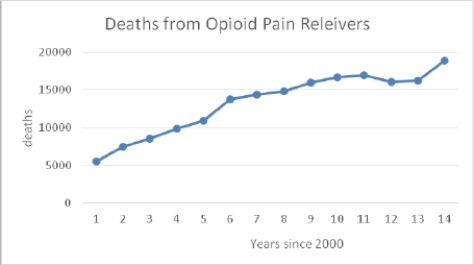
Which of the following statements is TRUE about the data?
A) There is a fairly steady upward trend in the number of deaths from opioid pain relievers over this entire time period.
B) The number of deaths for 2012 is a clear outlier.
C) The time period is too short to describe any pattern in the data.
D) None of these choices is correct.
Correct Answer:

Verified
Correct Answer:
Verified
Q1: The following histogram shows body temperatures (in
Q3: During winter, red foxes hunt small rodents
Q4: The estimated annual number of smoking-attributable
Q5: The following histogram shows body temperatures (in
Q6: Some variables that were recorded while studying
Q7: A sample of 55 streams in severe
Q8: Every month, the Gallup polling organization tracks
Q9: Here are records of eye color
Q10: The EPA sends out a survey to
Q11: Every month, the Gallup polling organization tracks