Multiple Choice
The following dotplot shows migraine intensity (on a scale of 1 to 10) for 29 adults suffering from recurring migraines.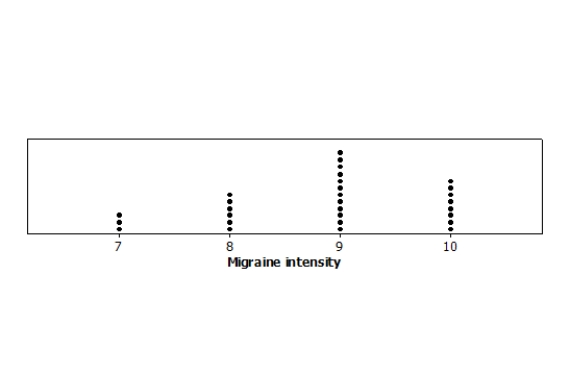 What is the best description of this distribution?
A) Symmetric with 3 outliers
B) Moderately left-skewed
C) Moderately right-skewed
D) Multimodal
Correct Answer:

Verified
Correct Answer:
Verified
Q26: The following graph shows the percent of
Q27: A survey records many variables of interest
Q28: A sample of 40 endangered species was
Q29: The following histogram shows the yearly number
Q30: The following graph shows the percent of
Q32: The following graph shows the percent of
Q33: Some variables were recorded while surveying plants
Q34: The U.S. Global Change Research Program examined
Q35: What is important to do when drawing
Q36: The U.S. Global Change Research Program examined