Multiple Choice
The following graph shows the percent of adult hemodialysis patients who received adequate dialysis (urea reduction ratio 65% or greater) , by age, over the 2002-2007 period.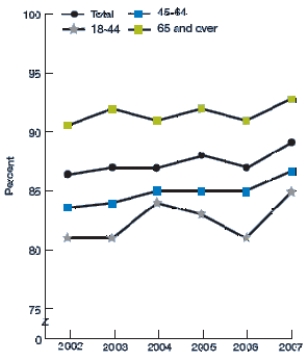 Which of the following statements about these data is NOT correct?
A) From 2002 to 2007, the overall percent of adult hemodialysis patients receiving adequate dialysis improved from about 86% to about 89%.
B) Comparing 2002 to 2007 data, improvements in the percent of adult hemodialysis patients receiving adequate dialysis were observed among all age groups.
C) In all years, adults age 18-44 and 45-64 were less likely than adults age 65 and older to receive adequate dialysis.
D) From 2002 to 2007, data for adults age 18 to 44 indicate a clear cyclical pattern.
Correct Answer:

Verified
Correct Answer:
Verified
Q25: The estimated annual number of smoking-attributable
Q26: The following graph shows the percent of
Q27: A survey records many variables of interest
Q28: A sample of 40 endangered species was
Q29: The following histogram shows the yearly number
Q31: The following dotplot shows migraine intensity (on
Q32: The following graph shows the percent of
Q33: Some variables were recorded while surveying plants
Q34: The U.S. Global Change Research Program examined
Q35: What is important to do when drawing