Multiple Choice
The following histogram shows the yearly number of unprovoked attacks by alligators on people in Florida over a 33-year period.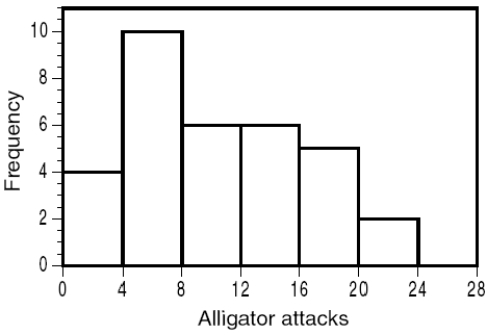 What is the overall shape of the distribution?
A) Bimodal
B) Slightly skewed to the right
C) Strongly skewed to the left
D) Roughly symmetric with an outlier
Correct Answer:

Verified
Correct Answer:
Verified
Q24: For a biology lab course containing
Q25: The estimated annual number of smoking-attributable
Q26: The following graph shows the percent of
Q27: A survey records many variables of interest
Q28: A sample of 40 endangered species was
Q30: The following graph shows the percent of
Q31: The following dotplot shows migraine intensity (on
Q32: The following graph shows the percent of
Q33: Some variables were recorded while surveying plants
Q34: The U.S. Global Change Research Program examined