Short Answer
Use the table and network below to answer parts (a) through (d).
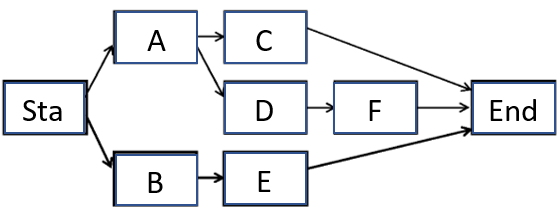 (a) On the network above, show ES, EF, LS, and LF for every event.
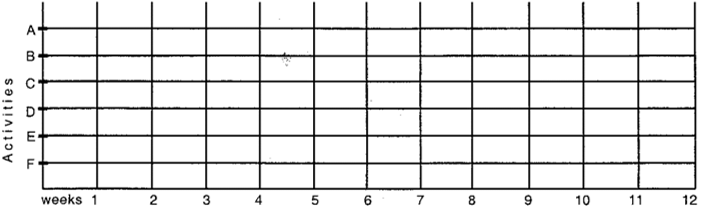
(b) Below, construct a Gantt chart for the network using only ES's and EF's.
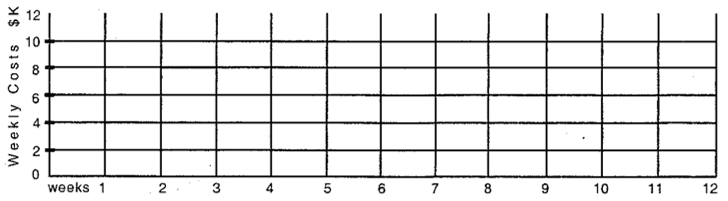
 (C)Using costs from the table and the Gantt chart in (b), show weekly costs for the project.
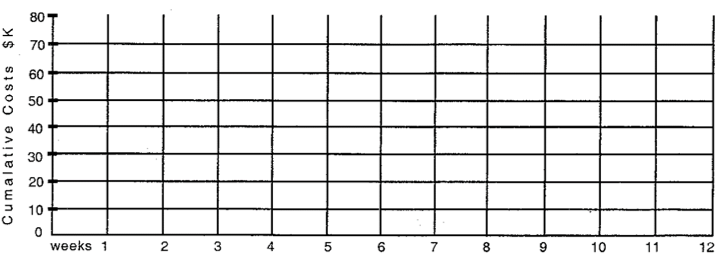
 (d) Below, using the chart in (c) as a guide, construct a chart showing estimated cumulative project expenditures.
Correct Answer:

Verified
Correct Answer:
Verified
Q6: In the PDM method (circle all that
Q7: In a network, the critical path indicates:<br>A)
Q8: The critical path:<br>A) is shortest path through
Q9: The forward and backward pass:<br>A) determine the
Q10: If an activity has two immediate successors
Q12: The early expected start time, ES, of
Q13: Statement: The term "dummy activity" is a
Q14: Statement: If an activity has multiple predecessors,
Q15: In a network, the critical path is
Q16: Level the resources for the activities below: