Short Answer
Annual measurements of the number of powerboat registrations (in thousands) and the number of manatees killed by powerboats in Florida were collected over the 14 years 1977-1990. A scatterplot of the data, least squares regression line, and correlation coefficient follow. 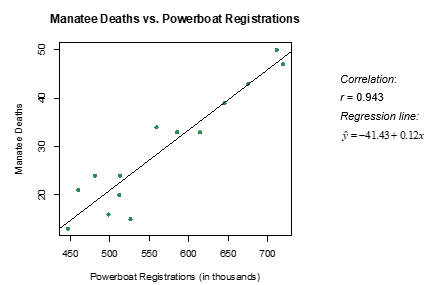
-Fill in the blanks with the appropriate values to interpret the y-intercept:
We predict ___(1)____ manatee deaths when there are ____(2)____ powerboat registrations.
Correct Answer:

Verified
Correct Answer:
Verified
Q18: Which of the following plots has the
Q19: Annual measurements of the number of powerboat
Q20: The following scatterplot displays the finish time
Q21: A student in an AP Statistics class
Q22: The following scatterplot displays the finish time
Q24: The least squares regression line minimizes the
Q25: Data from gapminder.org on 184 countries was
Q26: It is commonly expected that as a
Q27: Babies born with low birth weights (less
Q28: Annual measurements of the number of powerboat