Multiple Choice
Which of the following plots has the strongest correlation between the two variables plotted?
A) 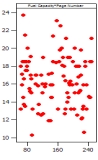
B) 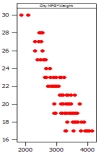
C) 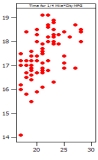
D) 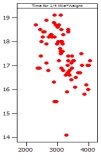
Correct Answer:

Verified
Correct Answer:
Verified
Related Questions
Q13: Data from the World Bank for 25
Q14: The following scatterplot displays the finish time
Q15: It is commonly expected that as a
Q16: A student in an AP Statistics class
Q17: The following scatterplot displays the finish time
Q19: Annual measurements of the number of powerboat
Q20: The following scatterplot displays the finish time
Q21: A student in an AP Statistics class
Q22: The following scatterplot displays the finish time
Q23: Annual measurements of the number of powerboat