Multiple Choice
The following scatterplot displays the finish time (in minutes) and age (in years) for the male racers at the 2018 Strawberry Stampede (a 10k race through Arroyo Grande) . 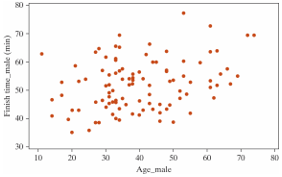
-What is the form of this scatterplot?
A) Linear
B) Non-linear
Correct Answer:

Verified
Correct Answer:
Verified
Related Questions
Q15: It is commonly expected that as a
Q16: A student in an AP Statistics class
Q17: The following scatterplot displays the finish time
Q18: Which of the following plots has the
Q19: Annual measurements of the number of powerboat
Q21: A student in an AP Statistics class
Q22: The following scatterplot displays the finish time
Q23: Annual measurements of the number of powerboat
Q24: The least squares regression line minimizes the
Q25: Data from gapminder.org on 184 countries was