Multiple Choice
Annual measurements of the number of powerboat registrations (in thousands) and the number of manatees killed by powerboats in Florida were collected over the 14 years 1977-1990. A scatterplot of the data, least squares regression line, and correlation coefficient follow. 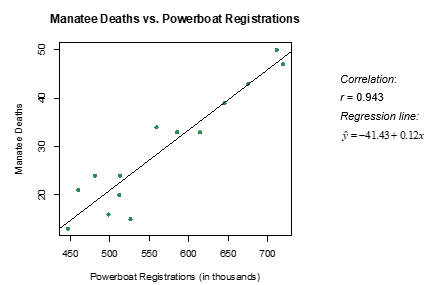
-Which of the following is a correct interpretation of the coefficient of determination?
A) About 94.3% of the variation in manatee deaths can be explained by the number of powerboat registrations.
B) About 88.9% of the variation in manatee deaths can be explained by the number of powerboat registrations.
C) An increase of 1,000 powerboat registrations is associated with a predicted increase of 0.943 manatee deaths.
D) An increase of 1,000 powerboat registrations is associated with a predicted increase of 0.889 manatee deaths.
Correct Answer:

Verified
Correct Answer:
Verified
Q14: The following scatterplot displays the finish time
Q15: It is commonly expected that as a
Q16: A student in an AP Statistics class
Q17: The following scatterplot displays the finish time
Q18: Which of the following plots has the
Q20: The following scatterplot displays the finish time
Q21: A student in an AP Statistics class
Q22: The following scatterplot displays the finish time
Q23: Annual measurements of the number of powerboat
Q24: The least squares regression line minimizes the