Multiple Choice
Figure 52.2 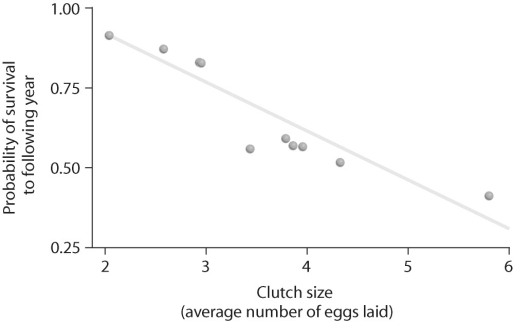
-Looking at the data in the figure above,what can be said about survival and clutch size?
A) Animals with low survival tend to have low clutch sizes.
B) High clutch sizes tend to produce animals with low survival.
C) Animals with high fecundity tend to live longer.
D) Animals with high fecundity tend not to live as long as animals with low fecundity.
Correct Answer:

Verified
Correct Answer:
Verified
Q13: Figure 52.14 <img src="https://d2lvgg3v3hfg70.cloudfront.net/TB3733/.jpg" alt="Figure 52.14
Q15: Figure 52.15 <img src="https://d2lvgg3v3hfg70.cloudfront.net/TB3733/.jpg" alt="Figure 52.15
Q15: Use the following abstract from Theoretical Population
Q16: Figure 52.3 <img src="https://d2lvgg3v3hfg70.cloudfront.net/TB3733/.jpg" alt="Figure 52.3
Q17: Figure 52.9 <img src="https://d2lvgg3v3hfg70.cloudfront.net/TB3733/.jpg" alt="Figure 52.9
Q24: <span class="ql-formula" data-value="\text {Life Table for Lacerta
Q24: If 40 individuals were alive in 1921
Q31: <img src="https://d2lvgg3v3hfg70.cloudfront.net/TB6548/.jpg" alt="
Q38: A model that estimates the likelihood that
Q48: The definition of a generation is _.<br>A)