Essay
The following data are the age (in years) and baby's birth weight (in grams) for a sample of 10 young women who gave birth as teenagers:
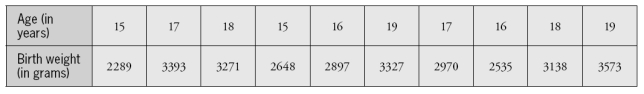 Consider the following summary statistics:
Mean age: 17.0 years
SD ages: 1.49 years
Mean birth weight: 3004 grams
SD birth weights: 414 grams
Correlation coefficient between age and birth weight: .884
-What percentage of variability in baby weights is explained by the linear relationship with mother's age?
Correct Answer:

Verified
The percentage of variability ...View Answer
Unlock this answer now
Get Access to more Verified Answers free of charge
Correct Answer:
Verified
View Answer
Unlock this answer now
Get Access to more Verified Answers free of charge
Q25: The following scatterplot displays the rushing yardage
Q26: Every month for a period of many
Q27: The following scatterplot displays the rushing yardage
Q28: A statistician found data in an advertisement
Q29: Naturalists recorded the following data on size
Q30: In a recent study of the effectiveness
Q31: The following four scatterplots pertain to a
Q32: A sample of students at a
Q33: A statistician found data in an advertisement
Q34: A sample of students at a university