Short Answer
The following scatterplots display the age (in months) at which a child first speaks and the child's score on a cognitive aptitude test taken later in childhood.
Graph A (on the left) displays all of the data in a sample, and Graph B (on the right) excludes the two children who took longer than 24 months to speak.
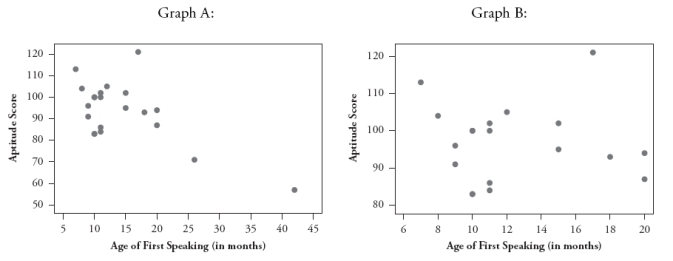 In one of these graphs the correlation coefficient is -.034, and in the other graph the correlation coefficient is -.640.
a. Identify which correlation coefficient goes with Graph A (on the left). Briefly explain your choice.
b. Write a paragraph, as if to the parent of an infant, summarizing what these scatterplots reveal about whether there is a relationship between the age at which a child first speaks and his/her cognitive aptitude.
Correct Answer:

Verified
a. The correlation coefficient for the g...View Answer
Unlock this answer now
Get Access to more Verified Answers free of charge
Correct Answer:
Verified
View Answer
Unlock this answer now
Get Access to more Verified Answers free of charge
Q15: Think of an example, not discussed in
Q16: A statistician found data in an advertisement
Q17: A sample of students at a university
Q18: In a large statistics class, students have
Q19: A sample of students at a university
Q21: The following scatterplot displays the number of
Q22: The following scatterplot displays lung capacity (forced
Q23: Suppose for each student in a statistics
Q24: Suppose you record data on these four
Q25: The following scatterplot displays the rushing yardage