Essay
The following scatterplot displays lung capacity (forced expiratory volume, measured in liters) vs. age (in years) for a sample of children:
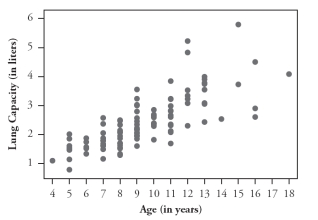 1-3. Comment on the direction, strength, and form of the relationship between lung capacity and age. (Be sure to relate your comments to the context.)
The following scatterplot also incorporates information about whether the child is a smoker:
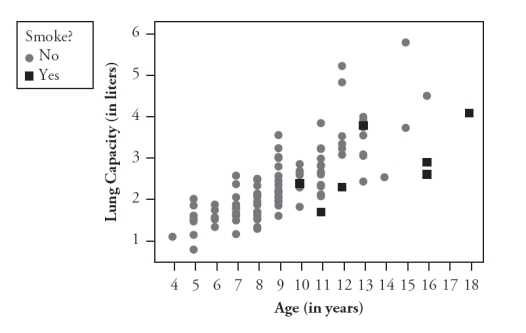 4. Do smokers tend to be older or younger than nonsmokers? Explain how you can tell from the graph.
5. For children of similar age, do smokers tend to have more or less lung capacity than nonsmokers? Explain how you can tell from the graph.
Correct Answer:

Verified
1-3. There is a moderately strong, posit...View Answer
Unlock this answer now
Get Access to more Verified Answers free of charge
Correct Answer:
Verified
View Answer
Unlock this answer now
Get Access to more Verified Answers free of charge
Q17: A sample of students at a university
Q18: In a large statistics class, students have
Q19: A sample of students at a university
Q20: The following scatterplots display the age (in
Q21: The following scatterplot displays the number of
Q23: Suppose for each student in a statistics
Q24: Suppose you record data on these four
Q25: The following scatterplot displays the rushing yardage
Q26: Every month for a period of many
Q27: The following scatterplot displays the rushing yardage