Short Answer
The following scatterplot displays the number of points scored by Kobe Bryant in each game of the 20062007 National Basketball Association season, as well as the number of shots that he attempted in each game:
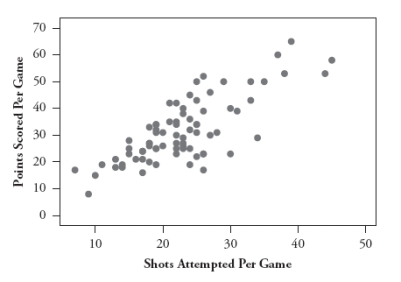 a. What are the observational units in this graph?
b. Use the following summary statistics to determine the equation of the least squares line for predicting points from shots.
Mean points: 31.56 SD points: 11.79
Mean shots: 22.82 SD shots: 7.41
Correlation between points and shots: .770
c. Write a sentence interpreting the slope coefficient.
d. What proportion of the variability in Bryant's points is explained by the least squares line with number of shots?
e. Suppose Bryant was to play one more game and take 50 shots. Which would have a greater impact on the least squares line that you calculated in part b: if he were to score 60 points in that game or if he were to score 2 points? Explain your answer.
Correct Answer:

Verified
a. The observational units are the baske...View Answer
Unlock this answer now
Get Access to more Verified Answers free of charge
Correct Answer:
Verified
View Answer
Unlock this answer now
Get Access to more Verified Answers free of charge
Q16: A statistician found data in an advertisement
Q17: A sample of students at a university
Q18: In a large statistics class, students have
Q19: A sample of students at a university
Q20: The following scatterplots display the age (in
Q22: The following scatterplot displays lung capacity (forced
Q23: Suppose for each student in a statistics
Q24: Suppose you record data on these four
Q25: The following scatterplot displays the rushing yardage
Q26: Every month for a period of many