Multiple Choice
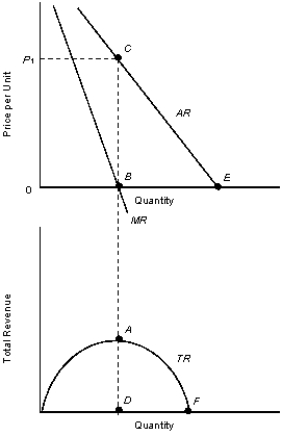
The figures given below represent the revenue curves of a monopolist.Figure 11.2
 TR: Total revenue curve
AR: Average revenue curve
MR: Marginal revenue curve
-If at an output of 10 units a monopolist is earning a positive profit, marginal revenue is $6, and marginal cost is $4, then the monopolist:
A) is in equilibrium.
B) should increase output.
C) should reduce output.
D) should lower the price at the current output level.
E) should raise the price at the current output level.
Correct Answer:

Verified
Correct Answer:
Verified
Q12: The figure given below shows the aggregate
Q13: The figure given below shows the cost
Q14: The figure below shows the market equilibrium
Q15: The figure given below shows the cost
Q16: The following figures show the demand and
Q18: The following figures show the demand and
Q19: The figures given below represent the revenue
Q20: The figures given below represent the revenue
Q21: The figure given below shows the cost
Q22: The figure given below shows the cost