Multiple Choice
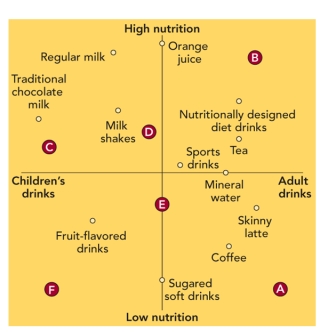
FIGURE 9-6 
-The perceptual map in Figure 9-6 above shows how various drinks are seen in the minds of adult consumers.Suppose a coffee producer wants to increase sales.Its advertising agency recommends that it run ads showing that coffee is healthier than one or more competitive drinks shown in the figure.In the ads, coffee should be compared with
A) skinny lattes.
B) fruit-flavored drinks.
C) sugared soft drinks.
D) fruit-flavored drinks and sugared soft drinks.
E) both sugared soft drinks and skinny lattes.
Correct Answer:

Verified
Correct Answer:
Verified
Q43: People who might become users of the
Q44: A perceptual map can be used to
Q45: Figure 9-6 above is a depiction of
Q46: In the sneaker market, Reebok and Nike
Q47: The second step in segmenting and targeting
Q49: After establishing the markets and product groupings
Q50: When new products or a new chain
Q52: The 80/20 rule is most closely related
Q53: A market-product grid is a framework to
Q118: Aggregating prospective buyers into groups that have