Multiple Choice
The histograms show the cost of living,in dollars,for 32 Canadian cities.The histogram on the left shows the cost of living for the 32 cities using bins $10 wide,and the histogram on the right displays the same data using bins that are $6 wide. 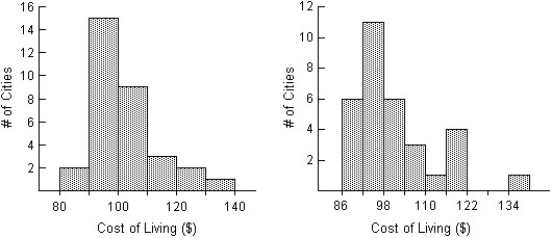
Compare the distributions (shape,centre,spread,unusual features) .
A) The distribution in the left histogram of the cost of living in the 32 Canadian cities is unimodal and skewed to the right.The distribution is centred around $100,and spread out,with values ranging from $80 to $140.The distribution in the right histogram appears bimodal,with many cities costing just under $104 and another smaller cluster around $119.There also appears to be an outlier in the right histogram at $134 that was not apparent in the histogram on the left.
B) The distribution in the left histogram of the cost of living in the 32 Canadian cities is unimodal and skewed to the right.The distribution is centred around $100,and spread out,with values ranging from $80 to $140.The distribution in the right histogram is unimodal and symmetric.The distribution is centred around $104,and spread out,with values ranging from $86 to $140.There also appears to be an outlier in the right histogram at $134 that was not apparent in the histogram on the left.
C) The distribution in the left histogram of the cost of living in the 32 Canadian cities is unimodal and skewed to the left.The distribution is centred around $100,and spread out,with values ranging from $80 to $140.The distribution in the right histogram appears bimodal,with many cities costing just under $104 and another smaller cluster around $119.There also appears to be an outlier in the right histogram at $134 that was not apparent in the histogram on the left.
D) The distribution in the left histogram of the cost of living in the 32 Canadian cities is unimodal and skewed to the right.The distribution is centred around $100,and spread out,with values ranging from $80 to $140.The distribution in the right histogram is also unimodal and skewed to the right.The distribution is centred around $104,and spread out,with values ranging from $86 to $140.There also appears to be an outlier in the right histogram at $134 that was not apparent in the histogram on the left.
E) The distribution in the left histogram of the cost of living in the 32 Canadian cities is unimodal and skewed to the right.The distribution is centred around $100,and spread out,with values ranging from $80 to $140.The distribution in the right histogram appears bimodal,with many cities costing just under $104 and another smaller cluster around $119.
Correct Answer:

Verified
Correct Answer:
Verified
Q4: The frequency table shows the weight,in kilograms,of
Q5: The reaction time of 20 drivers at
Q7: Here is a histogram of the assets
Q8: Shown below are the histogram and summary
Q10: Here are the summary statistics for the
Q11: Office workers were asked how long it
Q12: The back-to-back stem-and-leaf display compares the percent
Q13: Here are summary statistics of the last
Q14: The boxplots display case prices (in dollars)of
Q24: For which class are the mean and