Multiple Choice
Here is a histogram of the assets (in millions of dollars) of 71 companies.What aspect of this distribution makes it difficult to summarize,or to discuss,the centre and spread? What could be done with these data to make it easier to discuss the distribution? 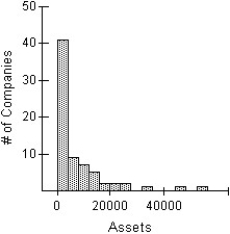
A) The distribution of assets of the 71 companies is heavily skewed to the right.The vast majority of the companies have assets represented in the first bar of the histogram,0 to 4000 dollars.This makes the discussion of the distribution meaningless.Re-expressing these data using logs or square roots might make the distribution nearly symmetric,and a meaningful discussion of centre and spread might be possible.
B) The distribution of assets of the 71 companies is heavily skewed to the left.The vast majority of the companies have assets represented in the first bar of the histogram,0 to 4 billion dollars.This makes the discussion of the distribution meaningless.Re-expressing these data using logs or square roots might make the distribution nearly symmetric,and a meaningful discussion of centre and spread might be possible.
C) The distribution of assets of the 71 companies is heavily skewed to the right.The vast majority of the companies have assets represented in the first bar of the histogram,0 to 4 billion dollars.This makes the discussion of the distribution meaningless.Re-expressing these data using logs or squares might make the distribution nearly symmetric,and a meaningful discussion of centre and spread might be possible.
D) The distribution of assets of the 71 companies is heavily skewed to the right.The vast majority of the companies have assets represented in the first bar of the histogram,0 to 4000 dollars.This makes the discussion of the distribution meaningless.Re-expressing these data using logs or squares might make the distribution nearly symmetric,and a meaningful discussion of centre and spread might be possible.
E) The distribution of assets of the 71 companies is heavily skewed to the right.The vast majority of the companies have assets represented in the first bar of the histogram,0 to 4 billion dollars.This makes the discussion of the distribution meaningless.Re-expressing these data using logs or square roots might make the distribution nearly symmetric,and a meaningful discussion of centre and spread might be possible.
Correct Answer:

Verified
Correct Answer:
Verified
Q3: Shown below are the histogram and summary
Q4: The frequency table shows the weight,in kilograms,of
Q5: The reaction time of 20 drivers at
Q8: Shown below are the histogram and summary
Q9: The histograms show the cost of living,in
Q10: Here are the summary statistics for the
Q11: Office workers were asked how long it
Q12: The back-to-back stem-and-leaf display compares the percent
Q24: For which class are the mean and
Q77: A local ice cream shop hand scoops