Multiple Choice
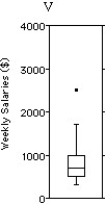
Shown below are the histogram and summary statistics for the weekly salaries (in dollars) of 24 randomly selected employees of a company: 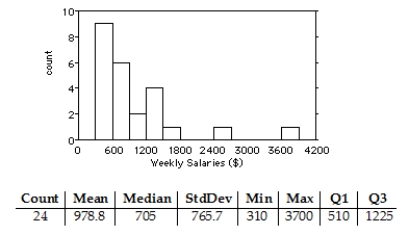
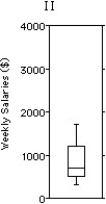
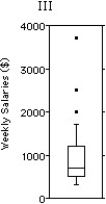
Choose the boxplot that represents the given data. 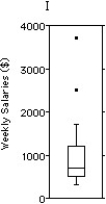

A) I
B) II
C) III
D) IV
E) V
Correct Answer:

Verified
Correct Answer:
Verified
Related Questions
Q3: Shown below are the histogram and summary
Q4: The frequency table shows the weight,in kilograms,of
Q5: The reaction time of 20 drivers at
Q7: Here is a histogram of the assets
Q9: The histograms show the cost of living,in
Q10: Here are the summary statistics for the
Q11: Office workers were asked how long it
Q12: The back-to-back stem-and-leaf display compares the percent
Q13: Here are summary statistics of the last
Q24: For which class are the mean and