Multiple Choice
Shown below are the histogram and summary statistics for the reading scores of 29 fifth graders. 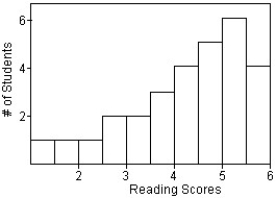

Which measures of centre and spread would you use for this distribution?
A) Mean and standard deviation,because the data is symmetric.
B) Median and IQR,because the data is skewed to the left.
C) Mean and standard deviation,because the data is skewed to the left.
D) Mean and IQR,because the data is skewed to the left.
E) Median and standard deviation,because the data is skewed to the left.
Correct Answer:

Verified
Correct Answer:
Verified
Q1: The ages of the 21 members of
Q4: The frequency table shows the weight,in kilograms,of
Q5: The reaction time of 20 drivers at
Q7: Here is a histogram of the assets
Q8: Shown below are the histogram and summary
Q9: The histograms show the cost of living,in
Q10: Here are the summary statistics for the
Q11: Office workers were asked how long it
Q24: For which class are the mean and
Q77: A local ice cream shop hand scoops