Multiple Choice
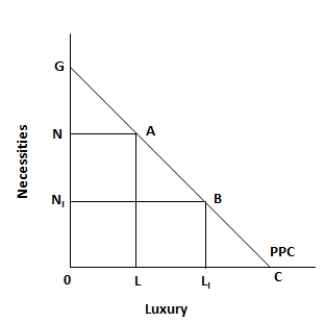
Figure 5.1. The figure shows a linear production possibility curve representing a tradeoff faced by a country, between necessities and luxuries. 
-Refer to figure 5.1. What does the movement from point A to point B on the production possibility curve indicate?
A) It indicates that there is an increase in the demand for luxury goods in the country.
B) It indicates that there is an increase in the demand for necessities in the country.
C) It indicates that there is a fall in the per capita income of the people in the country.
D) It indicates that there is an increase in the price of the luxury goods.
E) It indicates that there is a tax rebate provided by the government of the country.
Correct Answer:

Verified
Correct Answer:
Verified
Q58: Figure 5.1. The figure shows a linear
Q59: Figure 5.2. The figure shows the supply
Q60: Figure 5.3. The figure shows the wage
Q61: Figure 5.3. The figure shows the wage
Q62: Figure 5.3. The figure shows the wage
Q63: Figure 5.2. The figure shows the supply
Q64: Figure 5.2. The figure shows the supply
Q65: Figure 5.3. The figure shows the wage
Q66: Figure 5.2. The figure shows the supply
Q67: Figure 5.1. The figure shows a linear